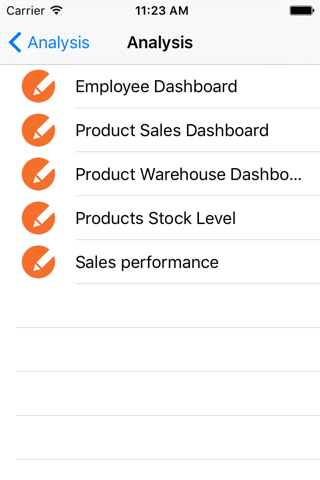
Integrated with Genialcloud Analysis, Mobile BI is an agile, automated App that allows for immediate access to information from mobile devices, adding "flexibility" and permission based access to its strengths.
Requires Genialcloud Analysis ver. 9.51
As an extension of Genialcloud Analysis SSRS, Mobile BI is not a mere viewer of static reports. Due to this mobile App’s capability of allowing end users to select various parameters and filters, customized views of detailed information can graphically be represented for easy consumption. Confronting the mountains of information made available, end users can easily choose to manage the quantity of information in order to derive quality reports of meaningful information for more effective decision making through targeted views.
Providing choice of favorites through tags and document sharing of reports / dashboards, Mobile BI provides a simple and intuitive interface, which acts as a "bridge" between Web and mobile.
Mobile BI takes into consideration all variables in information delivery to mobile devices. It takes advantage of navigational tools, logical functions, colour interfaces and diagrams, quick reference summary data representation methodologies, and drill up or drill down capabilities to ensure that users get the information they need, when they need it, customize when desired, and delivered in a manner in which they want to view it.
Permission based access to available information:
•Elegantly integrated with Analysis SSRS, allows permission based access to users and groups
•Refreshes data automatically, predefined by a schedule
•Allows full access to personalized lists of reports and dashboards
Pre-selection of variables and parameters for better detail:
•List of selected report variables based on multiple or exclusive filters
•Ability to filter employing variables for more meaningful reports
Immediate display of relevant and meaningful information:
•Use of color symbols and icons immediately visualize information within a predefined range or given value
•Tabular and graphical data views
•Data totals displayed in rows and columns
Navigation and information sharing:
•Summary of the selected parameters based on views
•Navigation between reports with relevant links
•Sharing of targeted data via email and document archiving


